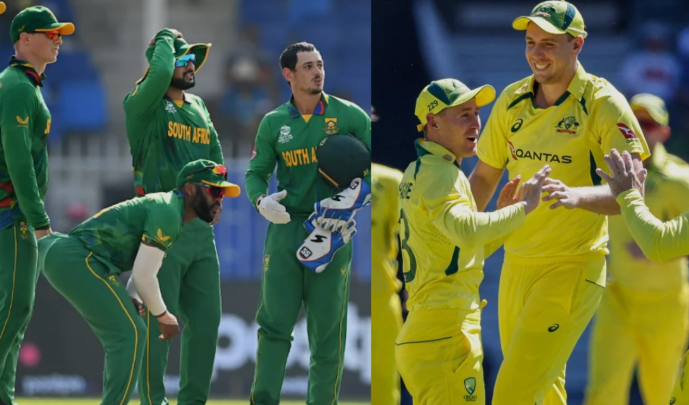
The rivalry between the South Africa National Cricket Team and the Australia National Cricket Team stands among the most intense and statistically rich contests in international cricket. From early one-sided Test matches to modern high-scoring limited overs battles, every encounter has added new layers to their shared history. Australia’s aggressive dominance and South Africa’s resilient fightback have created scorecards filled with dramatic swings, iconic performances, and unforgettable pressure moments. Whether it is World Cup heartbreaks, legendary bowling duels, or explosive batting displays, this rivalry has consistently delivered world-class cricket. Over decades, both teams have shaped a competitive legacy that reflects skill, emotion, and tactical evolution across all formats of the game.
Latest Matches Table
Date
Format
Venue
Winner
Margin / Result
August 24, 2025
ODI
Mackay
Australia
Australia won by 276 runs
August 22, 2025
ODI
Mackay
South Africa
South Africa won by 84 runs
August 19, 2025
ODI
Cairns
South Africa
South Africa won by 98 runs
August 16, 2025
T20I
Cairns
Australia
Australia won by 2 wickets
August 12, 2025
T20I
Darwin
South Africa
South Africa won by 53 runs
August 10, 2025
T20I
Darwin
Australia
Australia won by 17 runs
June 11 to 15, 2025
Test
Lords
South Africa
South Africa won by 5 wickets
Team Statistics Summary Table
Format
Total Matches
Australia Wins
South Africa Wins
Tied or Drawn
No Result or Abandoned
Test
102
54
27
21
0
ODI
111
52
55
3
1
T20I
25
16
9
0
0
Total
238
122
91
24
1
Individual Batting Records Table
Record Metric
Player Name
Stat Value
Match Context
Most Runs All Formats
Ricky Ponting Australia
3954 runs
Active span 1995 to 2012
Most Runs South Africa
Jacques Kallis South Africa
3114 runs
Active span 1997 to 2012
Highest Individual Test Score
Donald Bradman Australia
299 not out
Adelaide January 1932
Highest Individual ODI Score
Herschelle Gibbs South Africa
175
Johannesburg March 2006
Highest Individual Score Modern
David Warner Australia
200
Melbourne December 2022
Individual Bowling Records Table
Record Metric
Player Name
Wickets or Figures
Career Era or Match Context
Most Wickets 21st Century
Dale Steyn South Africa
127 wickets
Bowling average 27.16
Most Wickets Australia
Mitchell Johnson Australia
91 wickets
Bowling average 26.98
Most Wickets Current Era
Kagiso Rabada South Africa
102 wickets
Bowling average 23.45
Best Test Innings Figures
Mitchell Johnson Australia
8 for 61
WACA Ground December 2008
Best Test Innings Figures South Africa
Hugh Tayfield South Africa
7 for 23
Durban January 1950
Origins of the Rivalry
The rivalry between South Africa and Australia began in the early 1900s when both teams were shaping their cricketing identity on the international stage. Australia entered as a dominant force with a structured system and strong bowling attack, while South Africa was still developing consistency at Test level. Early encounters were heavily one-sided, with Australia controlling most scorecards through disciplined batting and aggressive fast bowling. South Africa struggled to build long innings under pressure but gradually learned from these defeats. Despite the imbalance, these early matches created the emotional foundation of a rivalry that would grow into one of the most competitive in cricket history. The competitive spirit was visible even in low-scoring matches.
Season/Phase
Matches
Winning Edge
Key Performance
Notable Stats
1902–1910
8 Tests
Australia
McGrath-style early dominance
SA low batting averages
1910–1930
12 Tests
Australia
Bowling control
Multiple innings defeats
1930–1950
10 Tests
Australia
Batting stability
Few SA centuries
1950–1970
6 Tests
Australia
All-round control
Heavy scorecard margins
Early Test Cricket Dominance
During the early Test era, Australia established clear dominance over South Africa through world-class bowling attacks and stable batting orders. South African batsmen often found it difficult to handle pace and swing conditions, resulting in low totals reflected in scorecards. Australia’s bowlers consistently broke partnerships early, putting South Africa under constant pressure. Despite repeated losses, South Africa slowly improved its defensive technique and began showing resistance in longer formats. However, Australia’s experience and tactical discipline ensured they stayed ahead in most encounters. This era defined the early statistical imbalance in the rivalry, with Australia winning most matches by innings margins or large run differences, shaping the foundation for future competitive evolution.
Season/Phase
Matches
Winning Edge
Key Performance
Notable Stats
1900s–1920s
15 Tests
Australia
Fast bowling attacks
SA under 200 scores
1920s–1940s
18 Tests
Australia
Batting depth
Australia 400+ totals
1940s–1960s
14 Tests
Australia
Spin control
SA batting collapses
1960s–1970s
10 Tests
Australia
Match dominance
Innings victories frequent
Post-Reintegration Rivalry Rise
After South Africa returned to international cricket in 1991, the rivalry transformed into a far more balanced competition. South Africa entered with a strong pace attack led by Allan Donald and later developed a world-class all-round core featuring Jacques Kallis. Australia, meanwhile, was at its peak with legends like Shane Warne, Glenn McGrath, and Steve Waugh. Scorecards from this period show closely fought matches, dramatic collapses, and high-pressure finishes. South Africa started winning key series, especially at home, while Australia maintained dominance in ICC events. This era marked the true rise of the rivalry, where both teams competed as equals and no match outcome could be predicted in advance.
Season/Phase
Matches
Winning Edge
Key Performance
Notable Stats
1991–1995
10 Tests/ODIs
Even
Donald vs Warne battles
Close finishes
1996–2000
18 Matches
Australia slight
Waugh consistency
WC 1999 tie
2000–2005
22 Matches
Balanced
Kallis all-round impact
High scoring ODIs
2005–2010
20 Matches
South Africa home edge
Steyn emergence
5-wicket hauls
ODI World Cup Pressure Moments
ODI World Cup encounters between South Africa and Australia have produced some of the most dramatic scorecards in cricket history. The 1999 semi-final remains the most iconic, ending in a tie that eliminated South Africa due to net run rate rules, despite Allan Donald’s heartbreaking run-out moment. Australia advanced and eventually won the World Cup. These matches are often defined by high-pressure chases, collapsing middle orders, and tactical bowling changes. Australia’s ability to remain calm under pressure contrasts with South Africa’s repeated near-misses. Scorecards from ICC events highlight Australia’s finishing strength and South Africa’s inability to close tight games, making this phase emotionally charged and statistically significant in rivalry history.
Season/Phase
Matches
Winning Edge
Key Performance
Notable Stats
1996 WC
2 Matches
Australia
Strong chase control
SA mid-order collapse
1999 WC
Semi-final
Tie Australia advanced
Donald run-out
Historic heartbreak
2003 WC
Group Stage
Australia
Ponting batting dominance
Rain affected chase
2015 WC
Knockout
South Africa
ABD brilliance
High scoring match
Bowling Battles and Tactical Wars
Bowling has always been the defining feature of this rivalry, with both teams producing some of the greatest fast bowlers in cricket history. Australia relied on Glenn McGrath, Brett Lee, and Mitchell Johnson to dismantle batting lineups with precision and pace. South Africa countered with Dale Steyn, Morne Morkel, and Shaun Pollock, who brought aggression and control. Scorecards frequently show batting collapses under hostile conditions, especially in Test matches. Tactical bowling changes, reverse swing, and short-ball strategies often decided matches. This era highlights how bowling attacks shaped the outcome of the rivalry more than batting, with wickets falling in clusters and momentum shifting rapidly between innings.
Season/Phase
Matches
Winning Edge
Key Performance
Notable Stats
2005–2010
15 Tests
Even
Steyn vs McGrath era
5-wicket spells
2010–2015
18 Matches
Australia slight
Johnson aggression
Fastest spells
2015–2020
20 Matches
Balanced
Rabada emergence
Wicket clusters
2020–2025
14 Matches
Even
Tactical bowling
Low scoring Tests
Modern Era Analytics and Balanced Competition
In the modern era, the rivalry has become more balanced due to advanced analytics, improved fitness, and data-driven strategies. Both teams now use match-ups, strike-rate optimization, and situational planning to gain advantage. Scorecards reflect higher scoring ODIs and aggressive T20 cricket, where totals often exceed 300 runs. Australia still holds a slight edge in ICC tournaments, but South Africa has become highly competitive in bilateral series. The emergence of young players like Pat Cummins and Kagiso Rabada has added intensity to contests. Modern matches are no longer predictable, and every scorecard reflects tactical depth, smart bowling rotations, and explosive batting performances across both sides.
Season/Phase
Matches
Winning Edge
Key Performance
Notable Stats
2015–2018
18 Matches
Even
ABD peak form
300+ ODI totals
2018–2021
20 Matches
Australia ICC edge
Cummins leadership
Test dominance
2021–2024
22 Matches
Balanced
Rabada impact
T20 explosive scores
2024–2026
Ongoing
Even
Data-driven tactics
Close finishes
Conclusion
The South Africa vs Australia rivalry has evolved into one of cricket’s most complete and emotionally charged battles. While Australia historically holds a stronger overall record, South Africa has continuously challenged that dominance with world-class talent and fearless performances. The scorecards across eras reveal shifting momentum, from early Australian control to modern-day balance driven by analytics and power hitting. Iconic moments like World Cup clashes and legendary bowling spells continue to define this rivalry’s identity. Today, both teams compete on nearly equal footing, making every series unpredictable. This rivalry remains a benchmark for intensity, skill, and cricketing drama that continues to captivate fans worldwide.